First of all, lets take a look at candle stick definition !

if the color of the bar is white, then the top of the bar refers to closing price.
if the color of the bar is black, the top of the bar refers to opening price.
this is because white refers to up trend and black refers to down trend
When a few of these candle sticks align to each other, certain patterns will form. Some patterns can help you predict what will come next.
However, bear in mind that NOT all prediction are Equal. Some are more reliable than another.
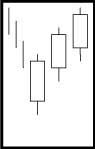
After studying all the basic candle stick patterns, these are the few ones with High Reliability.
When you see these patterns, it is almost guarantee the trend is going UP next !
 or
or 

or Morning Star above indicate an upcoming UP trend while Even Star predict Down trend. Other down trend patterns are as follows.
 or
or 
Once getting used to these patterns, it can help you to identify the right timing to enter or exit an invesment.
One point to emphasize is make sure you are very clear about the X axis. For example, speculator may want to use 1 or 5 minutes candle sticks to obtain daily income. On the other hand, a daily candle stick may be used to obtain weekly or monthly income.